This chapter is a visual guide to AITM's two graph views: the Contract Explorer (a map of all behavioral contracts in a project) and App Flow (a map of how one specific application element relates to everything else). It explains what each graph shows, how to read the nodes, colors and connecting lines, what the legend means, and what both views are actually for.
Contract Explorer & App Flow
If you don't yet know what a contract or the knowledge graph is, read Contracts, Knowledge Graph & Hints first. This chapter builds on it and focuses purely on how to navigate the two visualizations.
Contract Explorer — the project's contract map
What it's for: the Contract Explorer is an interactive graph of all behavioral contracts in a project — the stored facts about how each part of your code behaves. On a single screen you see how much knowledge AITM has about the project, how well it is covered by tests, which modules are the largest, and how contracts connect to files, variables and documentation. It's the fastest way to answer "what does AITM know about my project?" — and where the weak spots are (untested or failing contracts).
Where to find it: in the project panel, click the Contracts sub-tab (the project's sub-tabs are Develop, Testing, Archive, Setting, Optimize, Contracts, Graph and Multi Graph). The neighbouring Graph sub-tab draws the code graph of the project and Multi Graph draws it for all projects of the tab together (it is shown only when the tab has more than one project).
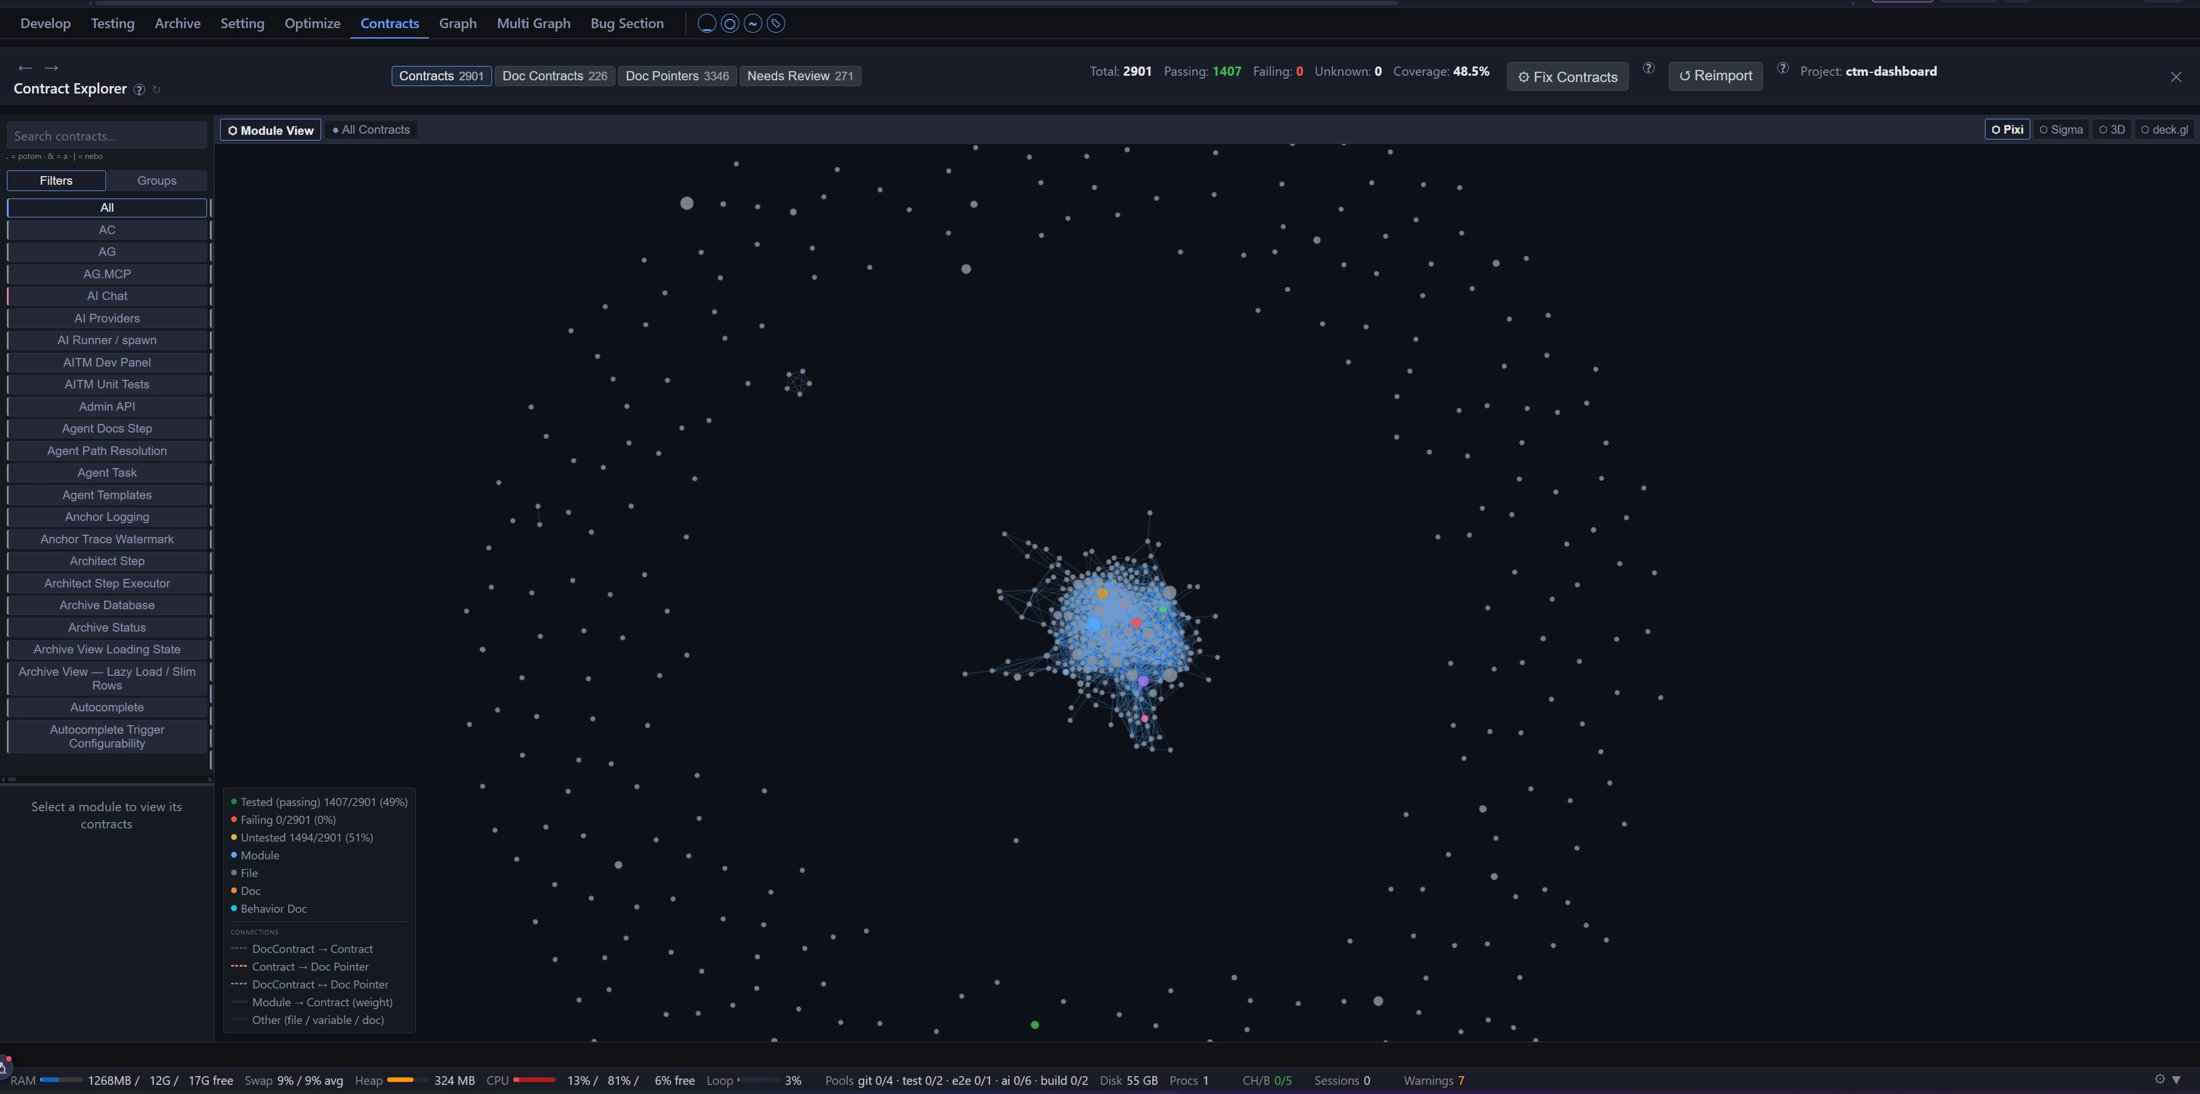
What's on the screen
The screen has four main areas:
- Top bar — dataset tabs, summary statistics and action buttons.
- Left sidebar — search, module filters and the contract list.
- Main graph area — the interactive graph (zoom with the mouse wheel, pan by dragging, nodes can be dragged around).
- Legend (overlay panel at the bottom left of the graph) — explains node colors and line types.
Top bar — tabs and statistics
| Element | Meaning |
|---|---|
| Contracts (count) | Contracts derived from code — the main dataset shown in the graph. |
| Doc Contracts (count) | Contracts extracted from documentation (task results). This tab shows a list instead of the graph. |
| Doc Pointers (count) | References from documentation files to contracts — "where in the docs is this written about". |
| Needs Review (count) | Contracts awaiting review (e.g. low confidence, or after a conflicting change). |
| Total / Passing / Failing / Unknown | Health summary: how many contracts exist, how many have passing tests, how many failing, how many unknown. |
| Coverage | Percentage of contracts covered by tests. |
| Fix Contracts | Starts a repair of inconsistent contracts. |
| Reimport | Re-reads contracts from the project sources (full-resync). |
Display levels — Module View vs. All Contracts
Above the graph is a detail-level switcher:
- Module View (the default for large projects, above 500 contracts) — each node is a whole module (e.g. "AI Chat", "Backup Service"). Bubble size reflects the number of contracts in the module; lines between modules mean they share source files. This is the "aerial view" — the ideal starting point.
- Clicking a module drills down into Module Detail — the graph shows the individual contracts of the selected module.
- All Contracts — the complete graph of every contract at once. On large projects it is capped at 500 nodes for performance (a badge shows the count, with a "Show all" link to deliberately bypass the cap).
In the top-right corner of the graph there is also a renderer switcher: SVG, Sigma (default — WebGL, handles large graphs), 3D, Cosmo and deck.gl. It doesn't change functionality, only how the graph is drawn — if the graph stutters on a big project, pick Sigma.
Reading the graph — nodes
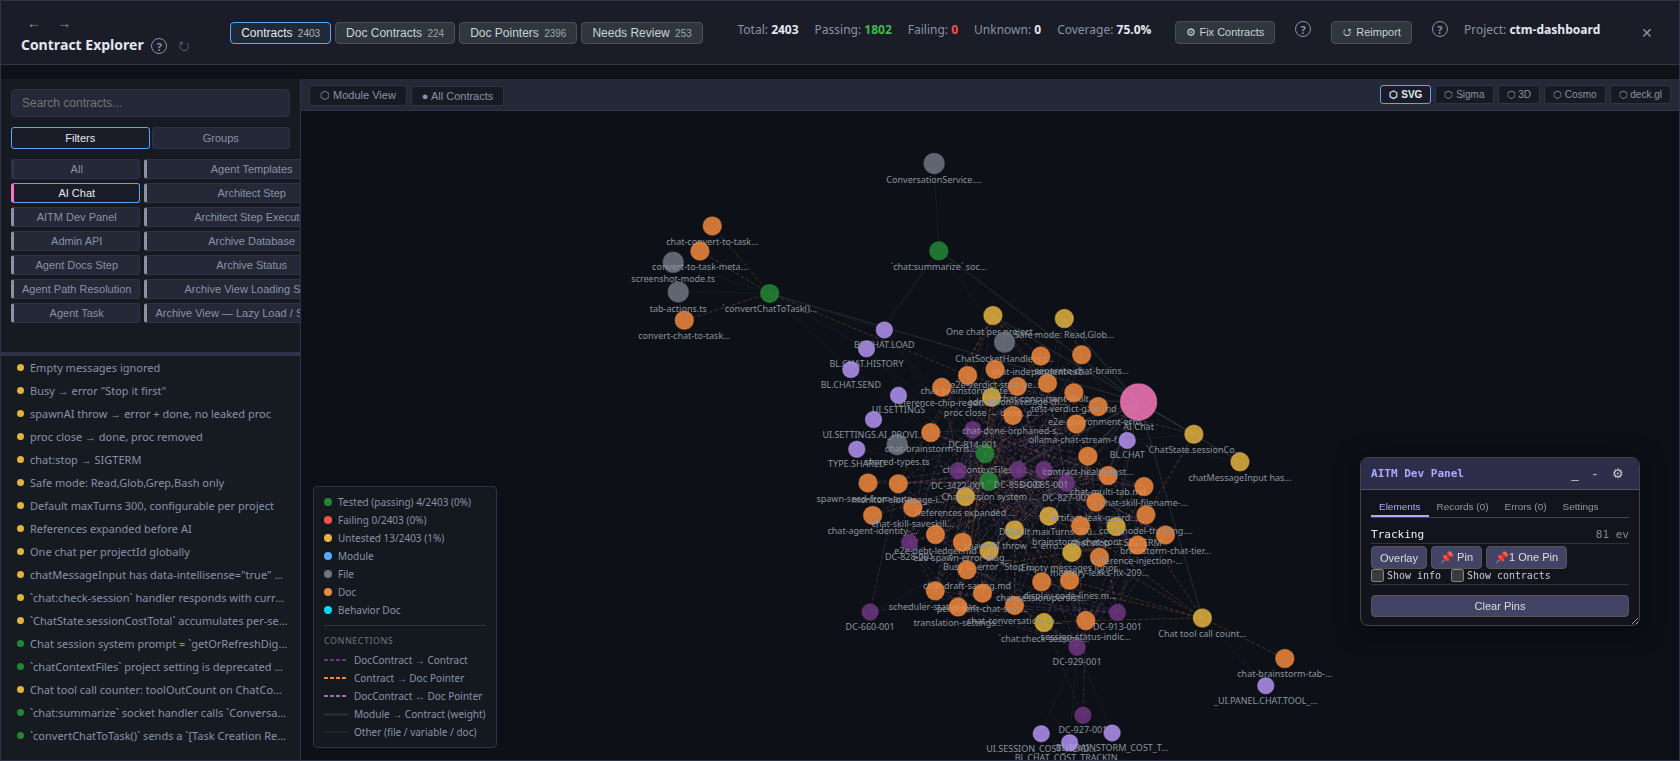
Each node (circle) is one entity. The color tells you the type — and for contracts, it simultaneously tells you the test status:
| Node color | Type / status | Meaning |
|---|---|---|
 green green | Contract — Tested (passing) | The contract has tests and they all pass. |
 red red | Contract — Failing | The contract has a failing test — look here first. |
 amber amber | Contract — Untested | A contract with no tests at all — the behavior is described but unguarded. |
 blue blue | Module | A module (group of contracts) — the main bubbles in Module View. |
 gray gray | File | A source file shared by contracts. |
 orange orange | Doc (Doc Pointer) | A documentation file referencing contracts. |
 purple purple | Doc Contract / variable | A documentation-derived contract, or a communication-language variable. |
 cyan cyan | Behavior Doc | A generated behavior description document. |
Bigger node = more significant entity (a module with more contracts, a danger-zone contract, etc.).
Reading the graph — lines (relationships)
Lines between nodes mean "these two things are related". The relationship type is encoded in the line style:
| Line style | Relationship | Meaning |
|---|---|---|
| solid | Module → Contract | The contract belongs to the module. In Module View the line weight reflects the number of files shared between modules. |
| solid thin | Contract → File / Variable / Doc | The contract touches a file, governs a variable, or is described by a document. |
| dashed purple | DocContract → Contract | A documentation contract confirms/extends a code contract. |
| dashed orange | Contract → Doc Pointer | A documentation file references the contract. |
| dashed light purple | DocContract ↔ Doc Pointer | The doc contract and the doc pointer share the same contract — the documentation chain. |
Practical reading: solid lines = relationships in code, dashed lines = relationships through documentation. A dashed line leading away from a contract means written documentation exists for it — click the orange node to open it right inside the app.
Legend
The legend (panel at the bottom left of the graph) summarizes exactly what is described above — node colors and connection types. For the three contract states it additionally shows live counts and percentages (e.g. Tested (passing) 4/2403 (0%)): how many contracts of the currently displayed set are in each state. The numbers recalculate with the active filter — in Module View they refer to the modules on screen, after drilling into a module to its contracts.
Left sidebar
- Search — full-text search across contract IDs, behavior descriptions, files and variables.
- Filters / Groups — switches between the module filter (buttons with module names;
Allclears the filter) and a grouped tree. - Contract list (bottom) — fills with the selected module's contracts. Each row has a colored dot with the same semantics as the graph nodes (green/red/amber), plus a
 icon for contracts in a danger zone (places where a small change historically caused outsized damage).
Contract detail
Clicking a contract (in the graph or in the list) opens the contract detail window:
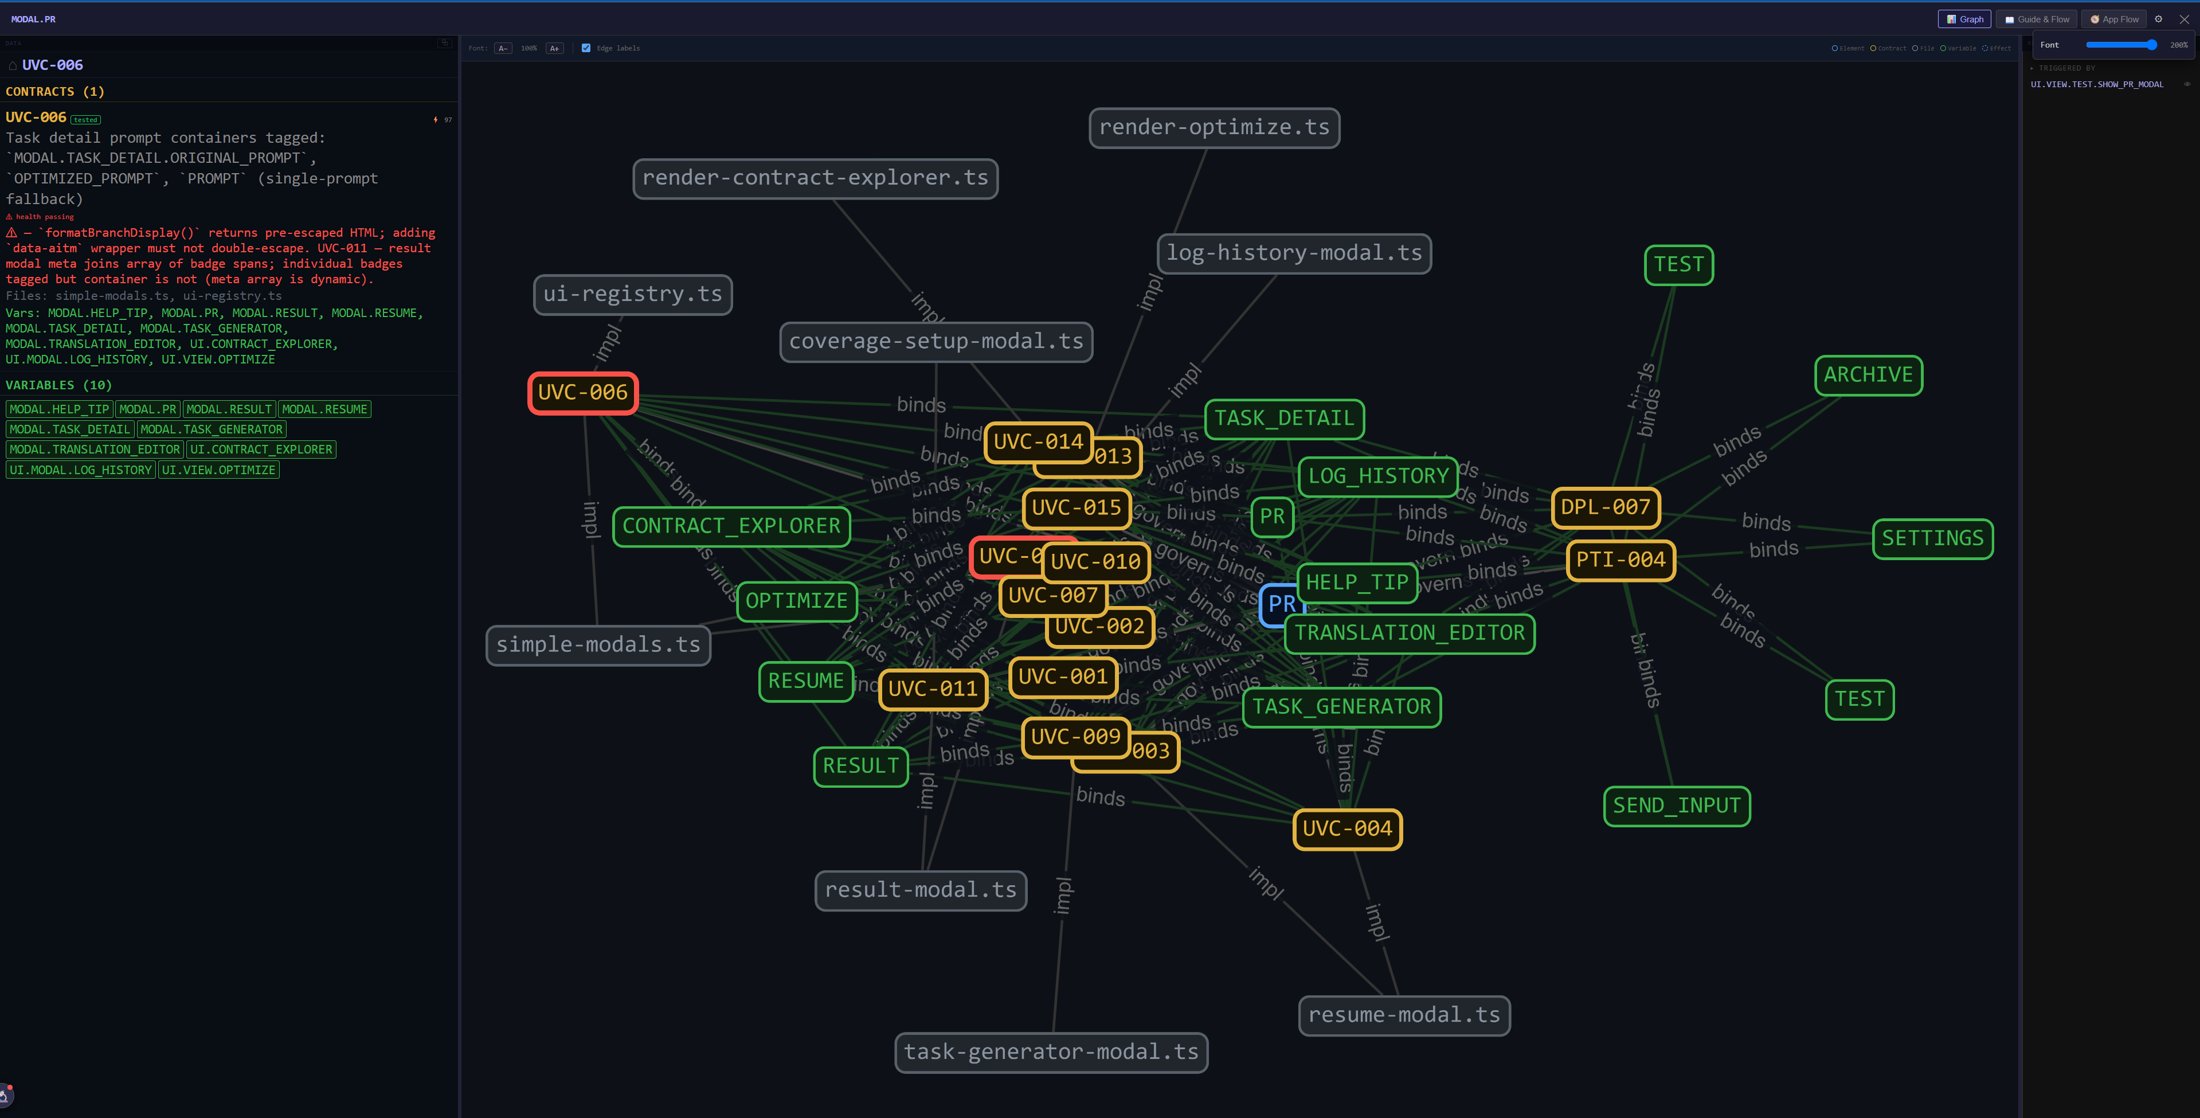
| Section | What it tells you |
|---|---|
| Header + badges | Contract ID (e.g. DPL-001), module, status (code-only = derived from code with no test, tested = has tests) and a health badge (unverified, passing, failing). |
| Behavior | The contract itself — one or two sentences precisely describing the behavior ("what this part does and what it returns when…"). |
| Tests | The tests guarding this behavior (file + test name). |
| Files | The source files the contract touches — click to filter the graph. |
| Variables | The communication-language variables (BL.*, UI.* …) the contract governs. |
| Reliability Score | The contract's reliability score (a mix of age, tests, change history). A low score = take the information with a grain of salt. |
| Related Tasks | Tasks that created or modified the contract. |
| Screenshot | For UI contracts, a preview of the element (captured during the pipeline's e2e step). |
| Change History | When and by which task the contract changed. |
| Related Contracts / Documentation | Sibling contracts (sharing files) and documents referencing this contract. |
At the top of the detail there are two important buttons:
 Assembled doc — opens the complete assembled document for the contract.
 Flow — jumps straight into the App Flow view (see below) centered on the contract's first variable. This is the bridge between the two visualizations: from "what holds" (the contract) to "how it fits into the app" (the flow).
App Flow — the relationship map of one element
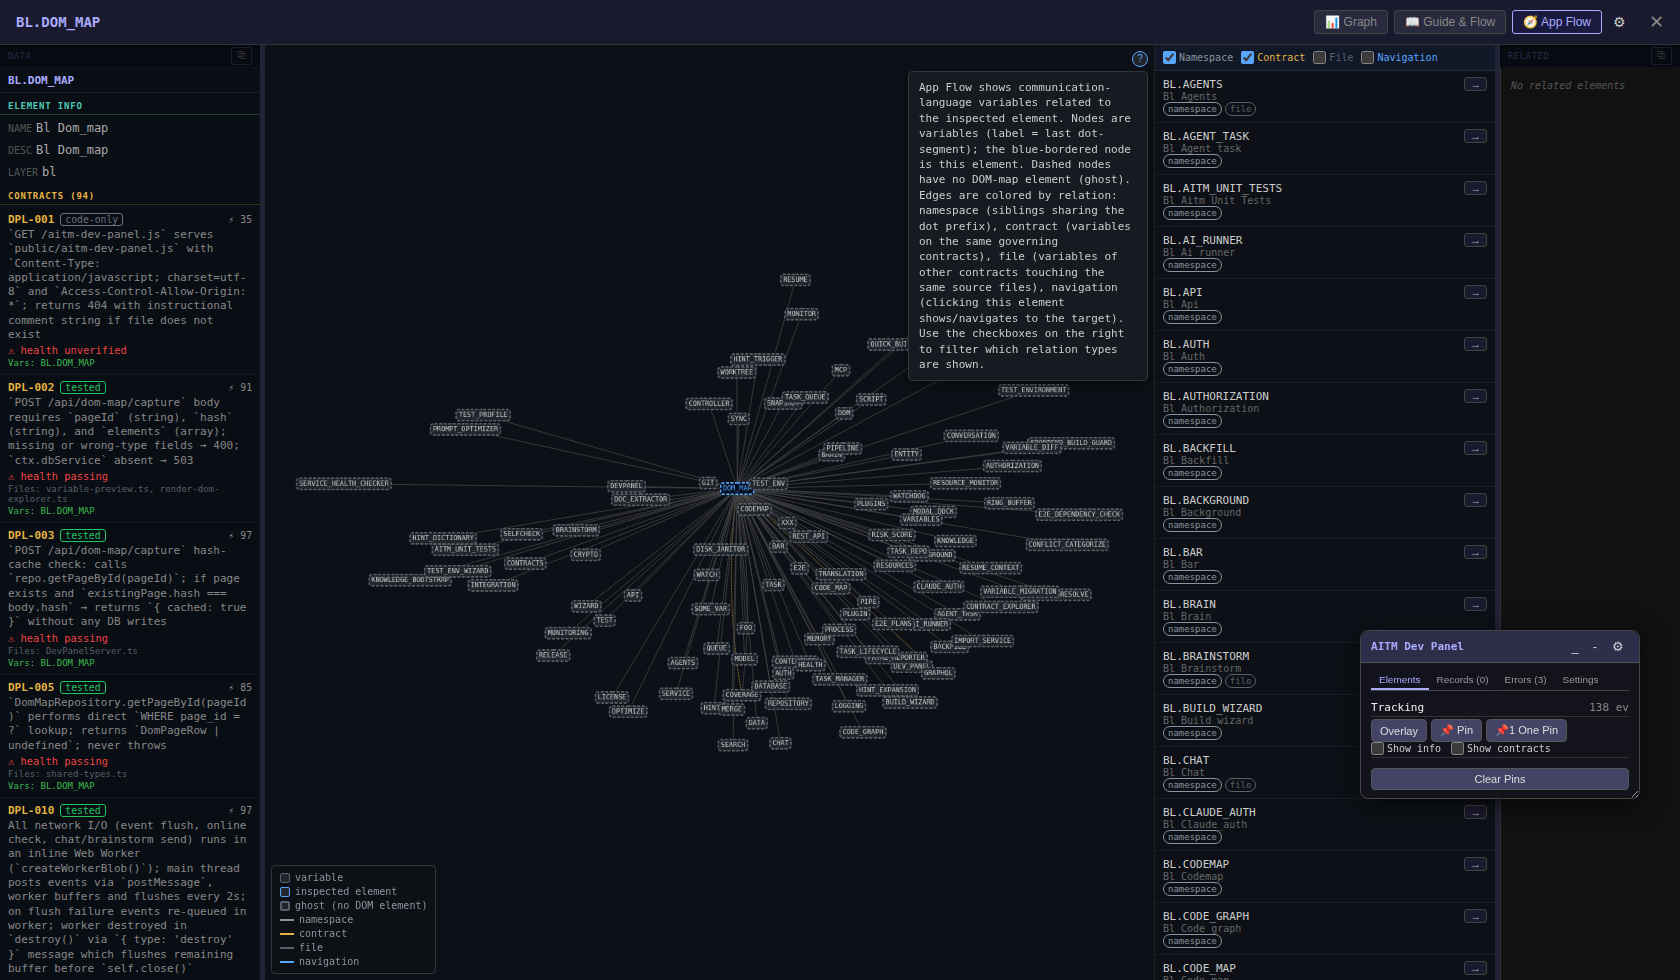
What it's for: while the Contract Explorer shows the project from above, App Flow answers "how does this one specific element relate to the rest of the application?". You see every communication-language variable neighboring the element — through its namespace, through shared contracts, through shared files, and through UI navigation. It is the ideal tool for estimating change impact ("if I touch this, what else is affected?") and for writing precise task prompts.
Where to find it:
- From the Dev Panel — in the running application, click an element; its detail window opens with the tabs Graph | Guide & Flow | App Flow.
- From the Contract Explorer — via the Flow button in the contract detail (see above).
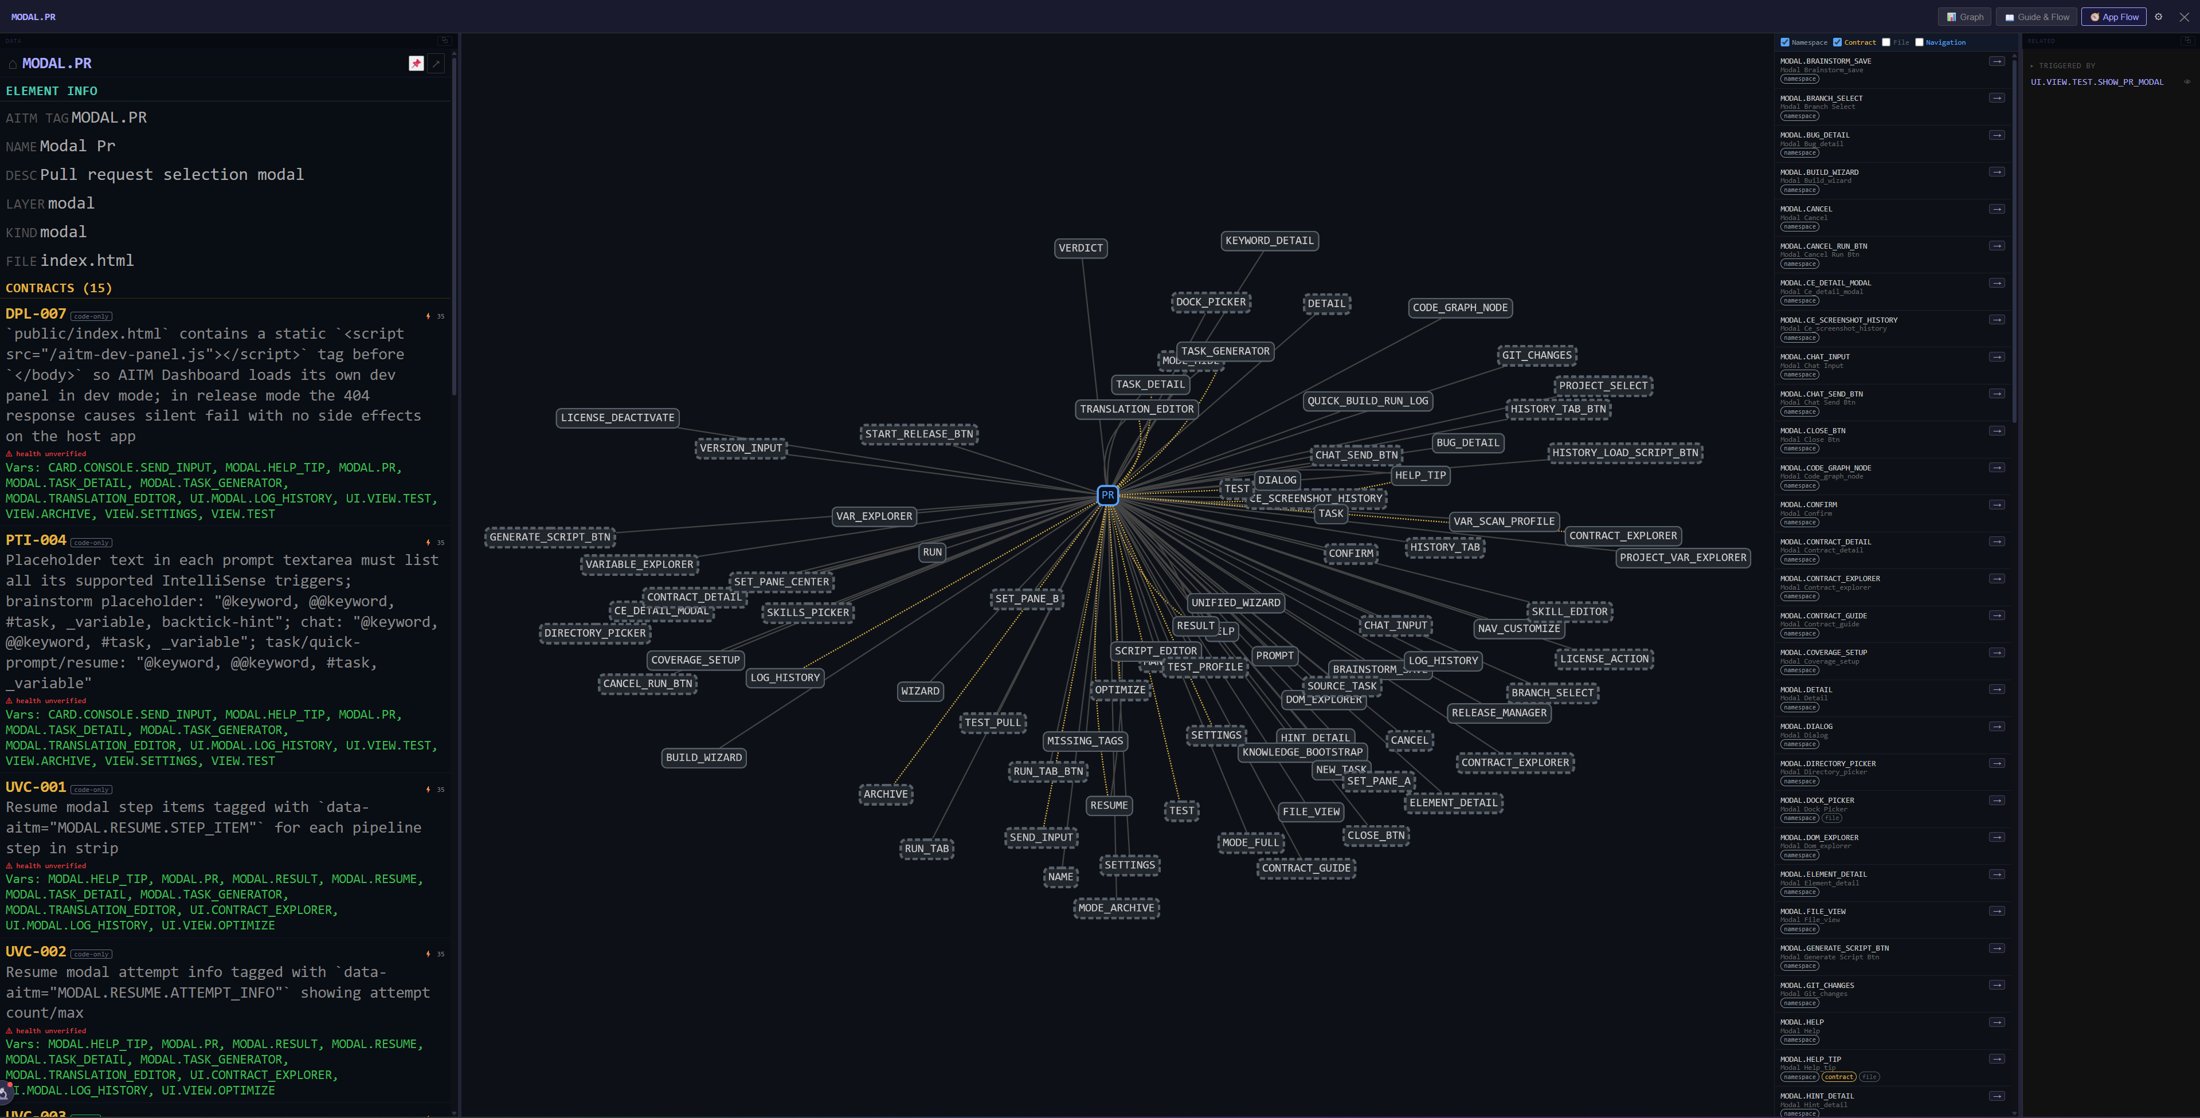
What's on the screen
- Left column — the inspected element's data: name, description, layer and above all the list of contracts governing it (with ID, test status, health, files and score). It's the same information as in the Contract Explorer, just from a single element's point of view.
- Center — graph — an interactive graph with the inspected element in the middle and related variables around it.
- Right panel — relationship-type filters (checkboxes) and the related variables list, mirroring the graph as a readable list.
Reading the graph — nodes
| Node appearance | Meaning |
|---|---|
| labeled rectangle | Variable — the label is the last segment of the dot notation (e.g. CODEMAP for BL.CODEMAP). |
| blue-bordered node | The inspected element — the center of the graph, the thing you clicked. |
| dashed border | Ghost node — a business-logic variable with no on-screen element of its own (e.g. a purely backend BL.* variable). Clicking a ghost node loads it into the left column, and it too can be pinned into a prompt. |
Reading the graph — edge colors (relationship types)
Every line is colored by why the variables are related:
| Edge color | Relationship | How it arises |
|---|---|---|
| gray | namespace | Namespace siblings — they share the dot prefix (e.g. UI.PANEL.CHAT and UI.PANEL.BRAINSTORM). Says "we belong to the same family". |
| amber | contract | Variables listed on the same contracts — their behavior is bound by the same rules. The most valuable relationship for impact analysis. |
 dark gray dark gray | file | Variables of other contracts touching the same source files — a relationship through code. |
| blue | navigation | A real-UI relationship: clicking this element shows/navigates to the target element (derived from the mapped DOM effects). |
Right panel — filters and list
At the top are four checkboxes — Namespace, Contract, File, Navigation — filtering both the graph and the list. By default Namespace + Contract are checked (the most useful, least noisy relationships); enable File and Navigation when you need to trace connections through code or through the UI flow.
Each list row shows the variable code, name and relationship-type badges. The  (insert into prompt) button pins the variable code straight into the task prompt you are writing — so the typical workflow is: find the element in the app → inspect its App Flow → pin the related variables → describe the change. The AI agent then receives exact addresses of the places the change concerns and doesn't have to search for them.
Legend and help
At the bottom left of the graph is the legend summarizing node styles and edge colors (exactly as described above). At the top right is the (?) button which opens a help popover explaining what App Flow shows and how each relationship type is derived:
Guide & Flow — the business-logic flow
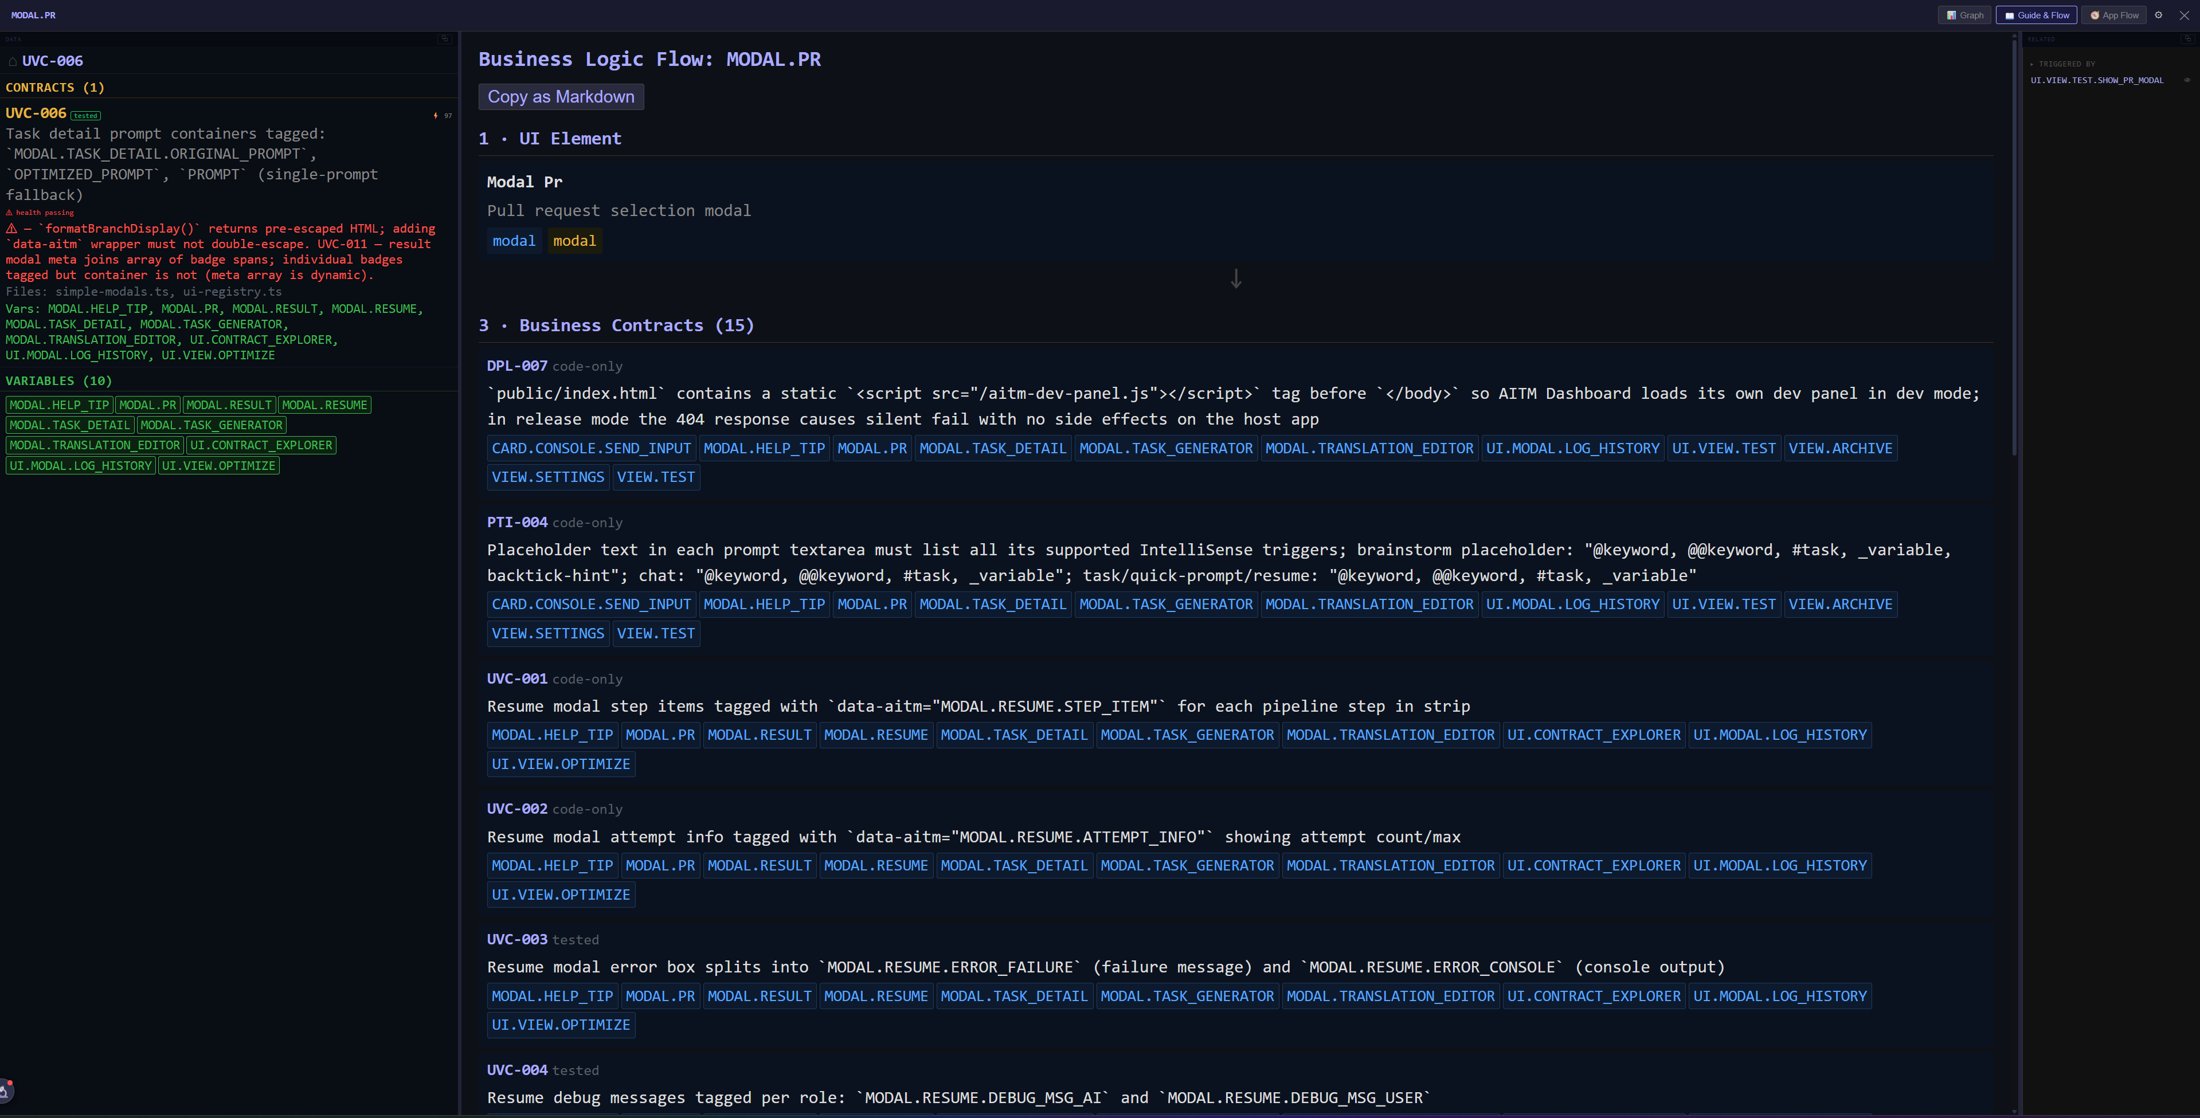
Next to App Flow, the element detail has a Guide & Flow tab. It explains the selected element top-down in plain steps — the UI element itself and then the business contracts that describe its behavior (each with the variables it concerns) — and the Copy as Markdown button copies the whole explanation to the clipboard, ready to paste into a task prompt.
AITM Dev Panel
What it is: a small floating toolbar that AITM can inject into the web application of a project it manages. While you use your application in the browser, the panel works as AITM's eyes inside it: it records the tagged UI elements it sees (building the project's map of screens, buttons and dialogs that the Contract Explorer and App Flow draw from) and it captures JavaScript errors from the browser console and sends them to AITM, where they show up for the project and can be turned into bug tasks.
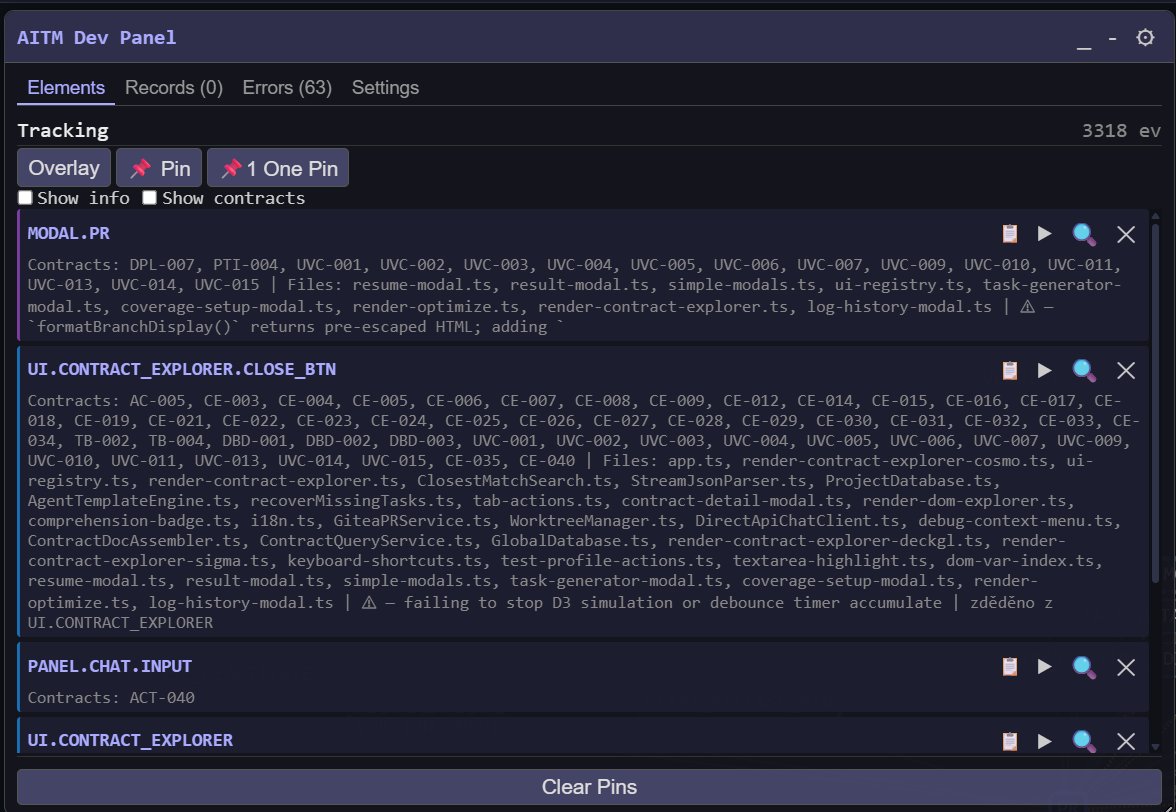
How it gets there: the panel is one script served by your AITM server and included in the application's page in development mode. The New Project Wizard adds it automatically to the web projects it creates; AITM's own dashboard has it too.
What you see: four tabs —
- Elements — the elements you clicked or pinned, each with its variable code, the contracts and files behind it, and warnings from danger-zone contracts. Overlay highlights all tagged elements on the page; Pin / One Pin collect elements for a prompt; the icons on each row copy the code, open the element's detail (Graph, Guide & Flow, App Flow) and remove the pin. Clear Pins empties the list.
- Records — the UI elements the panel has recorded from the page.
- Errors — JavaScript and console errors captured in this browser, with the count in the tab name.
- Settings — the panel's own options.
The panel only appears in development mode and is meant for you and the AI agents, not for the end users of your application. Its full documentation opens from the header menu: Help → AITM Dev Panel. Font sizes of the panel are adjustable in Settings → Font & Style.
Practical workflows
Find a module's weak spots: Contracts → Module View → click a module → look for amber (untested) and red (failing) nodes in the graph. The legend gives you the percentages at a glance.
Estimate change impact before filing a task: find the element in the app via the Dev Panel (or a contract in the Contract Explorer and the Flow button) → App Flow → enable the contract and file relationships → everything connected may be affected by your change.
Write a precise prompt: in App Flow, pin the relevant variables into the prompt — the task then speaks a language both you and the pipeline's AI agents understand (the communication language).
Check whether behavior is documented: in the Contract Explorer, follow the dashed lines from a contract — they lead to documents (orange nodes) that open with a click right inside the app.